Ten Minutes of Lightning Activity Prior to Tornado

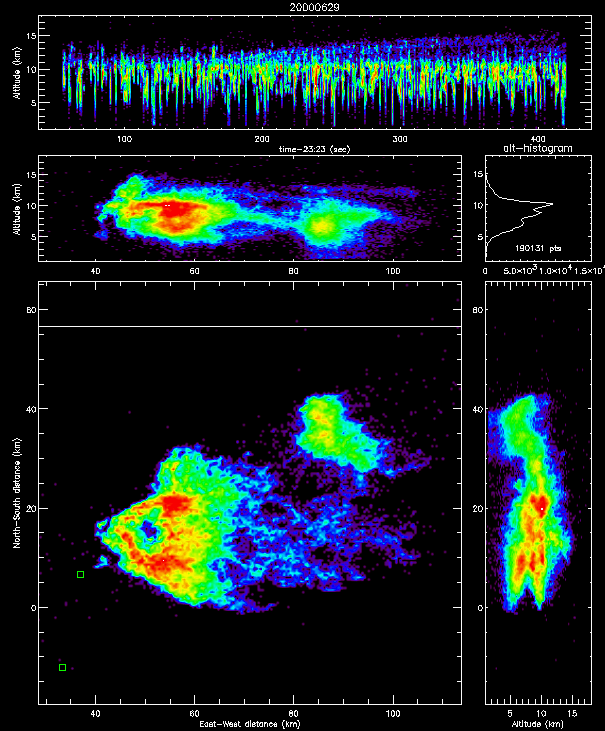
The following data plots show the occurrence of an overshooting convective top in the tornadic storm of June 29. The convective surge associated with the overshooting top caused the storm to intensify, which apparently resulted in the development of the tornado. The overshooting top started about 3 minutes before the onset of the tornado.
We are able to see the overshooting top in the lightning mapping observations because of the occurrence of numerous, small lightning discharges within the turret. Similar discharges were observed in overshooting convective tops in Oklahoma storms in 1998.
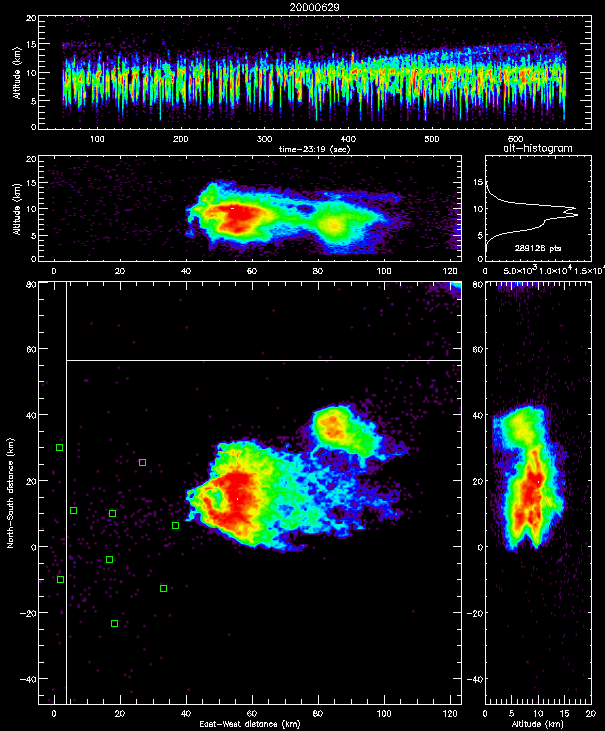
The figure below shows ten minutes of lightning activity in the tornadic storm, covering the time interval 23:20 to 23:30 UTC. The tornado was detected at 23:29 and lasted until 23:44. The overshooting top is indicated by the upward extension of the lightning beginning shortly after 400 seconds in the top, time-height panel of the figure. The tornado onset was at 600 seconds in the time-height panel, when the overshooting top reached its maximum height (15 km MSL). Both the overshooting top and the the lightning `hole' were precursors to the tornado onset. (See the previous page for information on the lightning hole.)
The overshooting top rose about 4 km in about 160 seconds, corresponding to a upward speed of 25 m/s (55 mph).

Shown below is an expanded view around the time of the overshooting top, between 23:24 and 23:30. The overshooting top is first seen in the lightning data at 200 seconds in the time-height panel, corresponding to 23:26:20. The tornado onset was at 23:29 (360 seconds in the time-height panel). The east-west and north-south vertical cross-sections show that the overshooting top occurred above the western edge of the storm, immediately left (west) of the lightning hole. The tornado formed in the same part of storm, namely on the western edge of the lightning hole (see previous page).

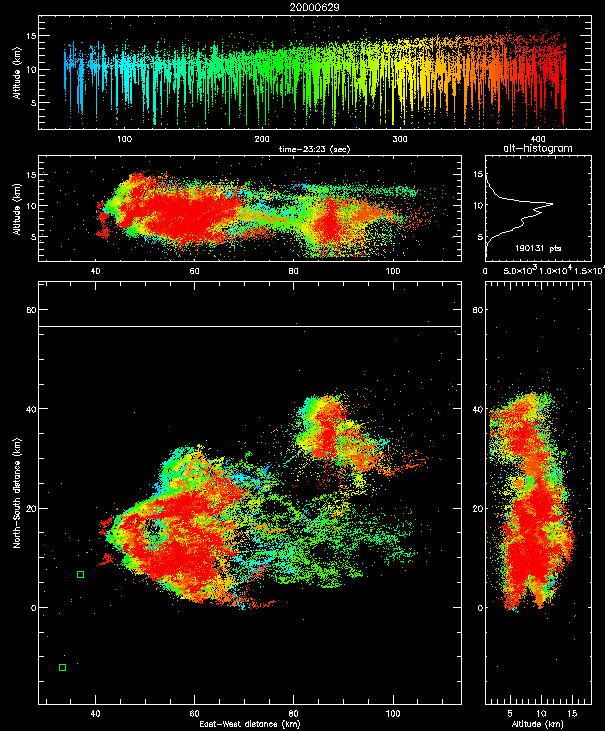
Shown below is the same data as above, except that the points indicate the location of individual impulsive radiation events of the lightning. (The previous plots show the density of radiation source events.) The individual source locations better show the amount and extent of the activity in the overshooting top.
