March 22, 2009 10:38 PM AKDT
Next
Start of event: March 23, 2009 06:38 UTC
(March 22, 2009 06:38 PM AKDT)
Lightning Mapping Data
An animation of the lightning sequence:
This event marks the beginning of the eruption of Redoubt, which was very weak electrically.
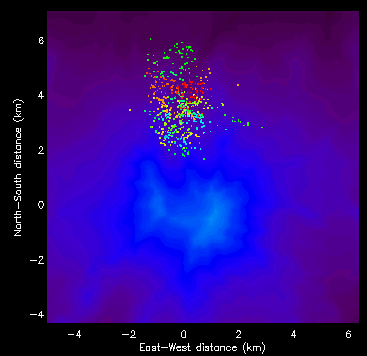
Three discrete discharges occurred approximately 20 minutes after the official start of the
eruption, and at the end of the time sequence shown below.
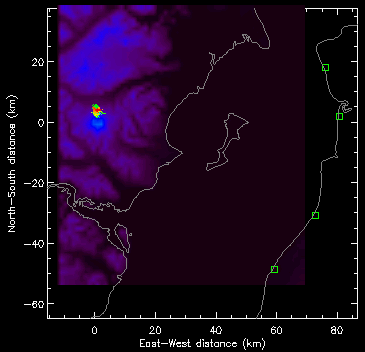
The discharges were located just north of the volcano, as shown above.
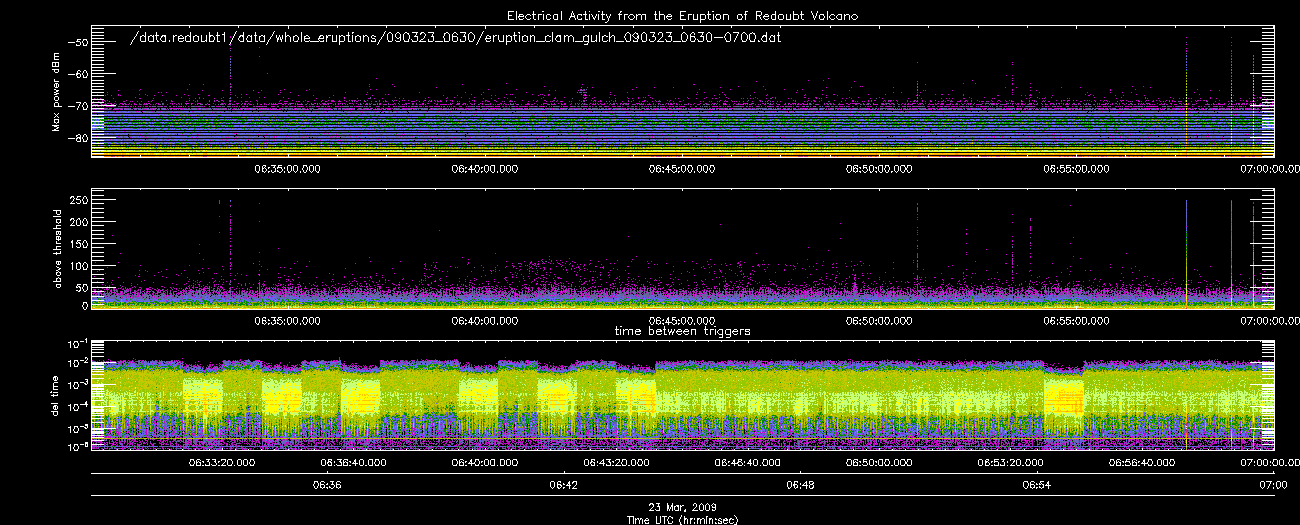
The lightning events can be seen in the raw data below. In the plot labelled
'All Stations,' the three discrete discharges show up as three colorful vertical
lines that appear in every graph towards the end of the time series. Since
these three vertical lines did occur at the same time time in each plot, we
conclude that these are real lightning sources, and not local noise. Local noise sources
may also appear as a vertical line, however it will not be correlated with the
other graphs.
Clam Gulch Station
All Stations
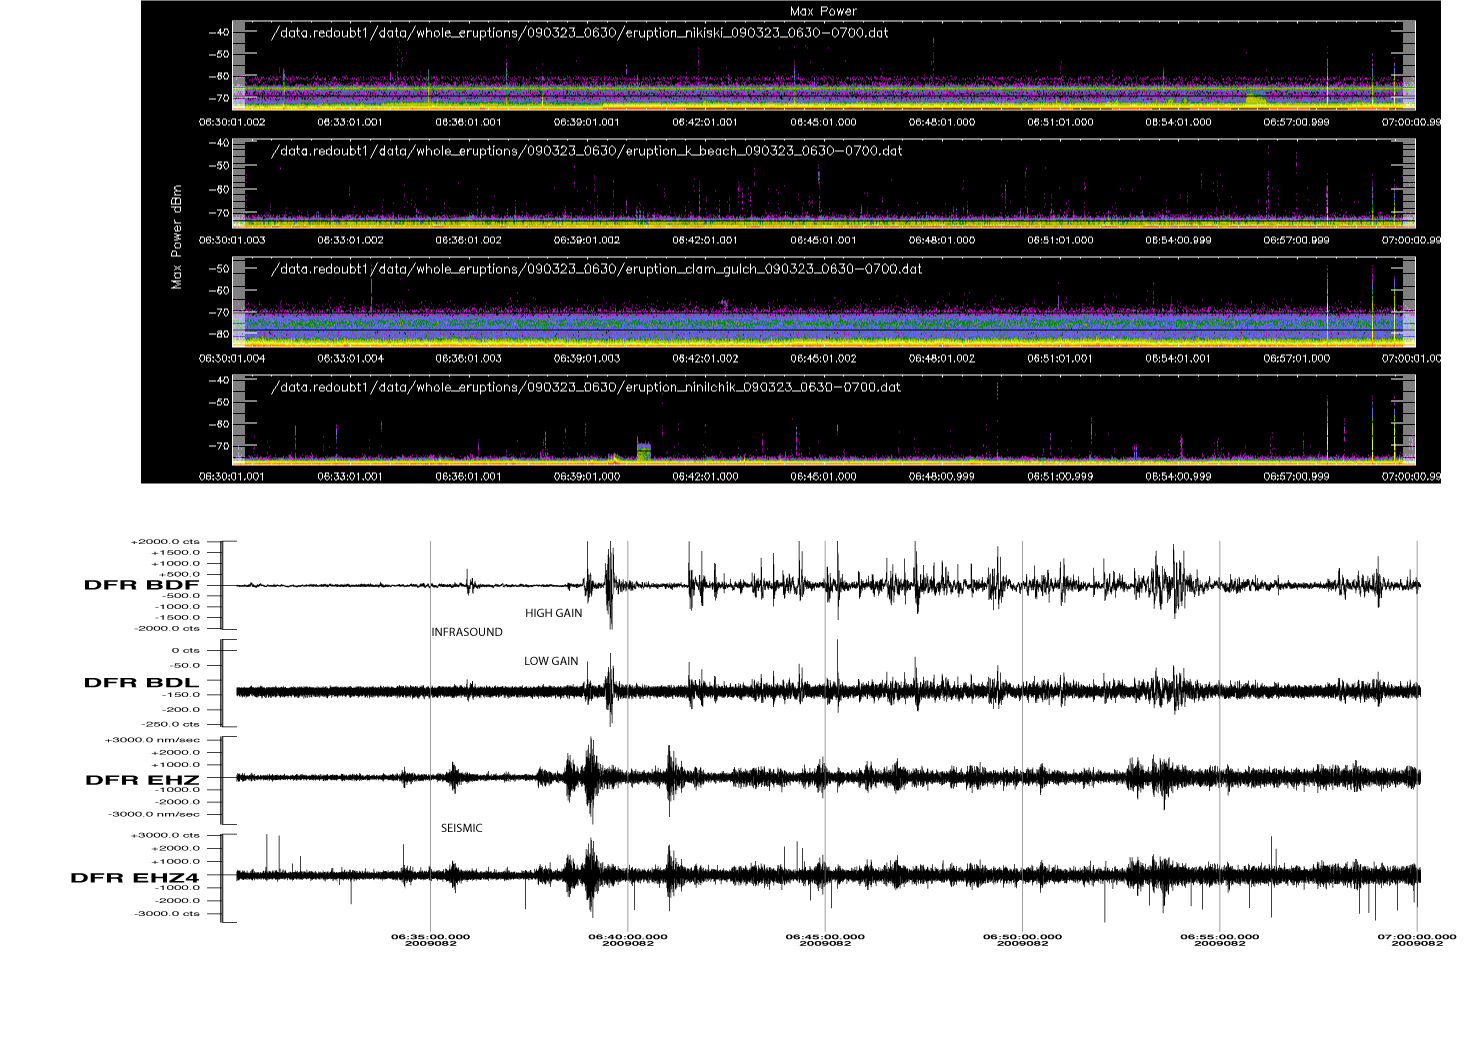 The figure above shows seismic and infrasound data from the Alaska Volcano
Observatory for the relevant time period. The four traces are from the DFR station (see the
map of the AVO station
locations). The top two traces are infrasound (high and low gain) and the bottom two
traces are seismic.
The figure above shows seismic and infrasound data from the Alaska Volcano
Observatory for the relevant time period. The four traces are from the DFR station (see the
map of the AVO station
locations). The top two traces are infrasound (high and low gain) and the bottom two
traces are seismic.