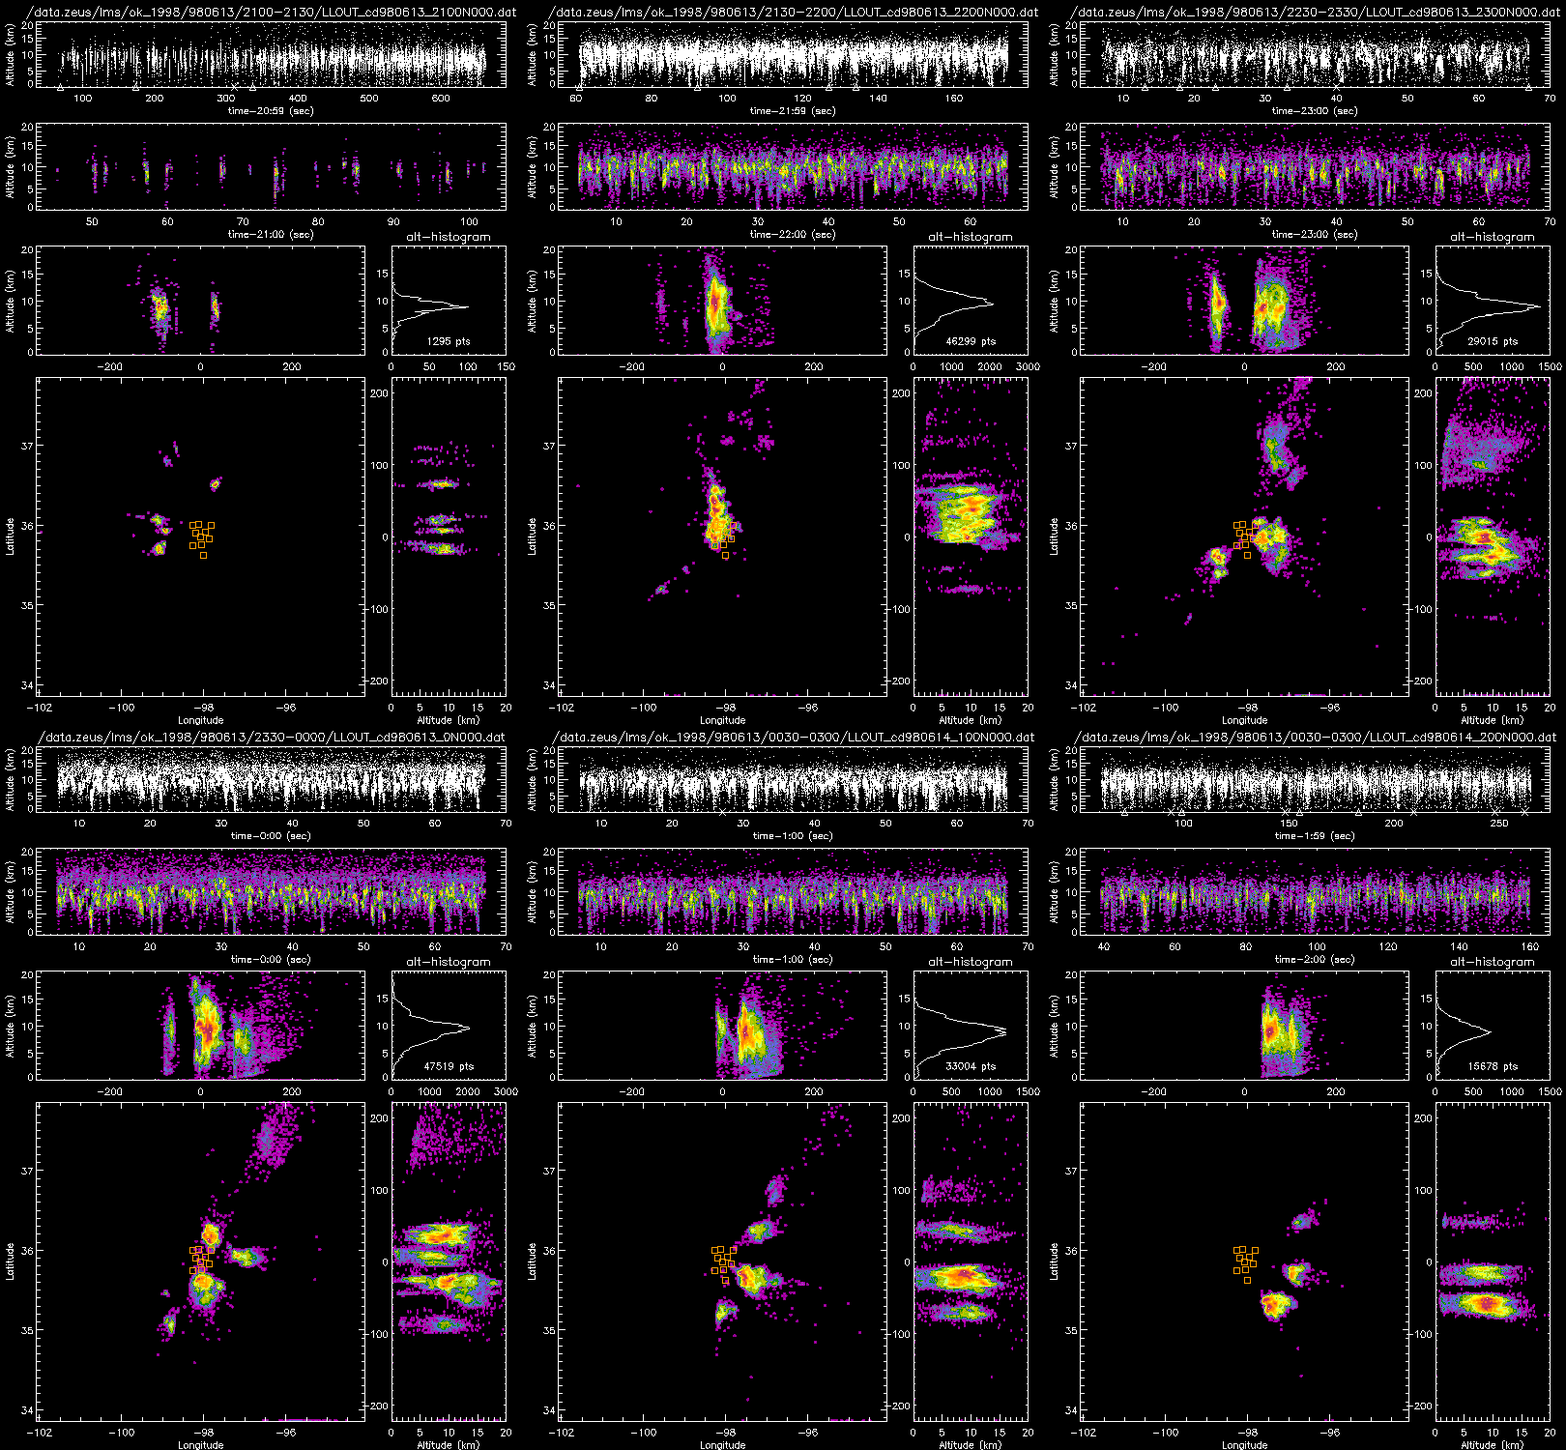
Time Evolution of Tornadic Storm on June 13, 1998
The following animation was produced from New Mexico Tech 3D LMS data. This is
a time animation, one frame out of every five minutes (one minute integration
time per frame), over the lifetime of a tornado producing storm in central Oklahoma
on June 13, 1998. The color scale represents event density of the RF sources, where the
transition from purple -> red represents increasing activity (log scale).
Click here to view again, or use your browser's
reload function.


